
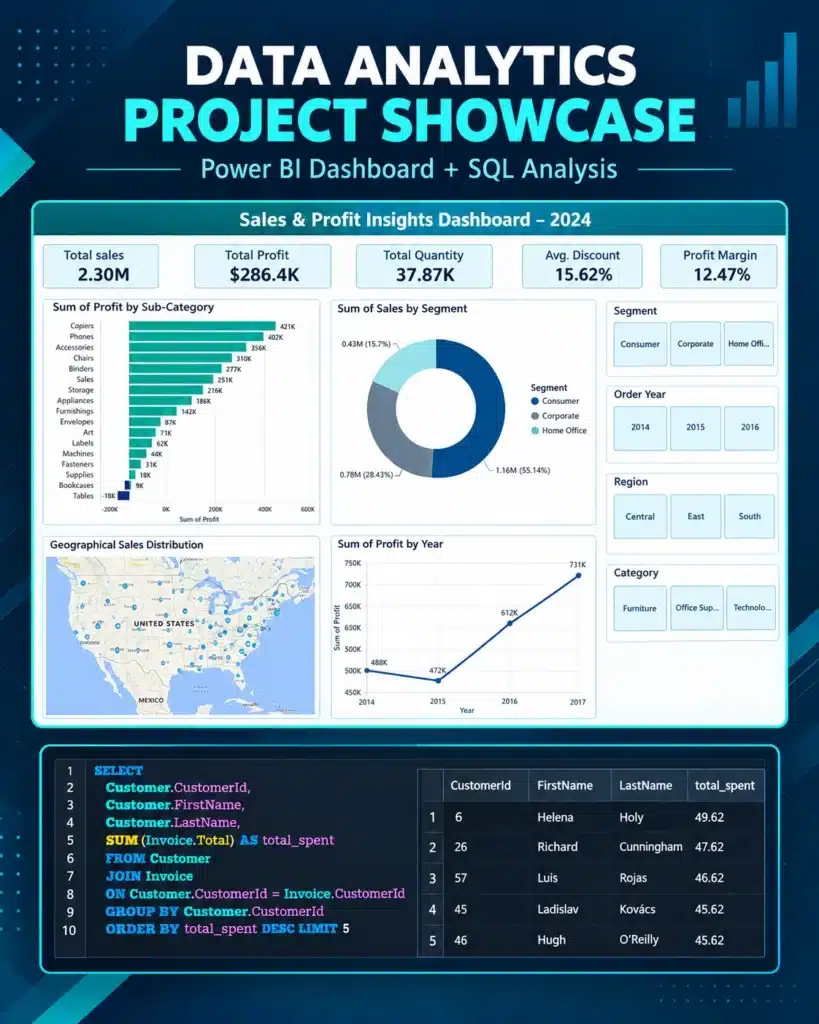
At Educational Excellence, Durgapur, students can develop practical data analysis skills through guided exercises, real-world datasets and project-based learning in the data analytics course. The programme covers essential tools used for data preparation, analysis, reporting and visualisation.
Learn how to analyse data, build dashboards and generate business insights with hands-on training in Excel, MySQL, Power BI, Tableau and Python.
Course duration: 3 Months
Course fee: ₹15,000
What will you learn?
Advanced Excel
Data cleaning, formulas, lookup functions, PivotTables, charts, Power Query basics and interactive dashboards.
SQL
Database fundamentals, filtering, aggregation, joins, subqueries and business data analysis.
Tableau
Charts, calculated fields, filters, dashboard design and data storytelling.
Or
Microsoft Power BI
Power Query, data modelling, DAX measures, interactive reports and business dashboards.
Python for Data Analysis
Python fundamentals, Pandas, NumPy basics, data cleaning and exploratory analysis.
Business Analytics Projects
KPI analysis, report interpretation, insight presentation and a final portfolio project.
Detailed course modules
This should be one of the most substantial sections on the page. Include the following syllabus as expandable accordion panels in WordPress if you want to keep the page compact.
Module 1: Advanced Excel for Data Analytics
Data types, sorting, filtering and data validation
IF, SUMIFS, COUNTIFS and logical functions
XLOOKUP and INDEX-MATCH
Text and date functions
PivotTables, PivotCharts and conditional formatting
Dashboard design and KPI reporting
Module 2: SQL
Database concepts and relational tables
SELECT, WHERE, ORDER BY and LIMIT
Aggregate functions and GROUP BY
INNER, LEFT and other JOINs
CASE statements and NULL handling
Subqueries and date functions
CTEs and window functions, subject to available class time
Module 3: Tableau
Connecting to datasets
Dimensions, measures and data types
Basic and advanced chart selection
Calculated fields and filters
Parameters and dashboard actions
Dashboard layout and data storytelling
Module 4: Microsoft Power BI
Importing data from Excel and databases
Power Query data cleaning and transformation
Relationships and data modelling
Measures, calculated columns and DAX basics
Cards, charts, slicers and interactive filters
Report layout and dashboard storytelling
Publishing and sharing reports where supported
Module 5: Python for Data Analysis
Python syntax, variables and data structures
Conditions, loops and functions
Jupyter Notebook
Pandas DataFrames and NumPy basics
Handling missing values and duplicates
Filtering, grouping and transforming data
Exploratory data analysis
Module 6: Capstone Project
Define a business problem and select KPIs
Validate and clean source data.
Perform analysis using suitable tools.
Build and explain a dashboard.
Document the project and findings.
Prepare a project portfolio and practise interview questions.
Who can join this data analytics course?
- College students who want to develop practical data skills.
- Graduates preparing for entry-level analyst roles.
- Freshers interested in Excel, SQL and dashboard reporting.
- Working professionals looking to improve their data analysis skills.
- Professionals from commerce, management, operations, sales or finance who work with reports and spreadsheets.
- Beginners who want a structured introduction to data analytics.
Why choose Educational Excellence?
- Practical learning: Exercises based on realistic business datasets.
- Multiple analytics tools: Training across spreadsheets, databases, and visualisation tools, based on the confirmed syllabus.
- Guided projects: Opportunities to practise analysis and dashboard creation.
What can you do with Data Analytics Skills?
Depending on your practical skills, portfolio and prior experience, relevant entry-level roles may include:
- Junior Data Analyst
- MIS Executive
- Reporting Analyst
- Business Intelligence Analyst
- Junior Reporting or Operations Analyst
Explain that employers may expect different combinations of Excel, SQL, BI tools, communication and business knowledge. Avoid salary guarantees or guaranteed placement claims unless you can substantiate them.
FAQ
What is the duration of the Data Analytics Course in Durgapur?
The programme is listed as a three-month course. Contact Educational Excellence to confirm the current batch schedule and class timings.
Can beginners join without coding knowledge?
Beginners can start with Excel and SQL fundamentals. They can introduce Python gradually as they build their analytical skills.
Who is eligible to join the course?
Students, graduates, freshers and working professionals interested in developing data analytics skills may be suitable. Basic computer knowledge is recommended.
Does the course guarantee a job?
No training course can guarantee a job unless an explicit, documented placement arrangement applies. Your outcomes will depend on your skills, portfolio and employer requirements.
Will I receive a certificate?
Yes, we provide an ISO certificate.
Can I attend a demo class before admission?
Contact Educational Excellence to ask about demo-class availability and the next batch start date.