
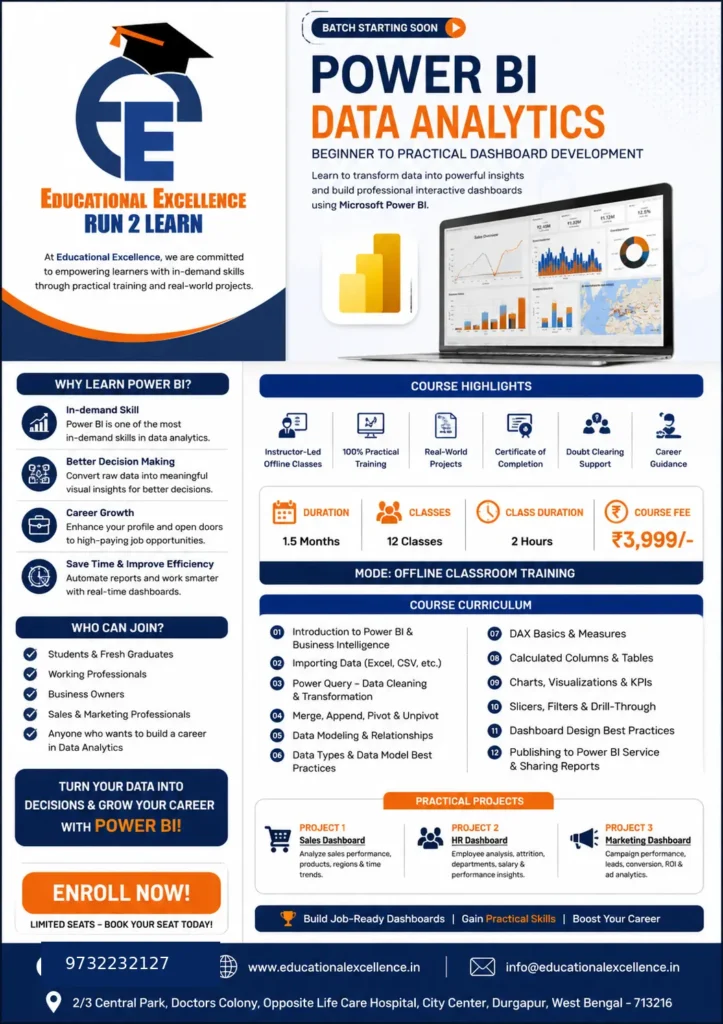
Educational Excellence offers a practical Power BI Course in Durgapur, designed for learners who want to progress from the fundamentals of Power BI to practical dashboard development.
For students, fresh graduates, working professionals, business owners and sales or marketing professionals who want to develop practical data analytics skills, learning Power BI can be a valuable career investment.
What Is Power BI?
Microsoft Power BI is a business intelligence and data visualization tool used to connect, clean, transform, analyze and visualize data. It allows users to create interactive dashboards and reports that make complex information easier to understand.
Instead of manually preparing repetitive reports, Power BI can help users automate reporting processes, identify trends and present important business metrics through charts, graphs, KPIs, slicers and interactive visualizations.
Power BI is widely relevant to areas such as:
- Business analytics
- Sales analytics
- Marketing analytics
- Financial reporting
- HR analytics
- Operations reporting
- Management dashboards
- Performance tracking
Why Learn Power BI ?
1. Develop an In-Demand Skill
Data-driven decision-making has become important across many industries. Learning Power BI can help learners develop practical skills in data analysis, visualization and dashboard creation.
2. Make Better Business Decisions
Power BI helps transform raw data into meaningful insights. Users can analyze sales performance, employee information, marketing campaigns, regional performance and other business metrics to support informed decisions.
3. Improve Career Opportunities
Power BI knowledge can complement profiles in business analysis, data analytics, sales, marketing, finance, HR and operations. For students and fresh graduates, practical dashboard projects can also help demonstrate their skills during interviews.
4. Save Time and Improve Reporting Efficiency
Interactive Power BI reports can reduce repetitive manual reporting work. Once data is properly connected and transformed, reports and dashboards can be refreshed and analyzed more efficiently.
What Will You Learn in the Power BI Course?
The Power BI Data Analytics Course at Educational Excellence follows a beginner-to-practical approach. The curriculum covers the important stages involved in creating professional Power BI dashboards.
Introduction to Power BI and Business Intelligence
Learners begin with the fundamentals of Power BI and understand how business intelligence can be used to analyze organizational data.
Importing Data
The course covers importing data from common sources such as Excel and CSV files, helping learners understand how external datasets can be brought into Power BI.
Power Query – Data Cleaning and Transformation
Data is often incomplete, inconsistent or incorrectly formatted. Power Query helps users clean and transform data before analysis. Learners are introduced to practical data preparation techniques.
Merge, Append, Pivot and Unpivot
These important Power Query operations help users combine datasets and restructure information for effective analysis.
Data Modeling and Relationships
A good data model is essential for building reliable reports. Learners explore data relationships, data types and best practices for creating an effective Power BI data model.
DAX Basics and Measures
DAX (Data Analysis Expressions) is used to create calculations and measures in Power BI. The course introduces learners to DAX basics and practical measures.
Calculated Columns and Tables
Learners understand the purpose of calculated columns and tables and how they can be used in Power BI data models.
Charts, Visualizations and KPIs
A dashboard should communicate information clearly. Learners work with different charts, visualizations and KPI elements to present data effectively.
Slicers, Filters and Drill-Through
Interactive features such as slicers, filters and drill-through allow users to explore reports and move from high-level information to more detailed analysis.
Dashboard Design Best Practices
The course also focuses on creating dashboards that are visually clear, organized and useful for decision-making.
Power BI Service and Report Sharing
Learners are introduced to publishing reports to Power BI Service and sharing dashboards and reports.
Practical Power BI Projects
Practical projects are an important part of the learning approach at Educational Excellence. The course includes project-based dashboard development in areas such as:
Sales Dashboard: Analyze sales performance, products, regions and time-based trends.
HR Dashboard: Analyze employee information, attrition, departments, salary-related information and performance insights.
Marketing Dashboard: Analyze campaign performance, leads, conversions, ROI and other marketing metrics.
These projects can help learners understand how Power BI is applied to realistic business scenarios rather than learning only theoretical concepts.
Who Can Join This Power BI Course?
The course is suitable for:
- Students and fresh graduates
- Working professionals
- Business owners
- Sales and marketing professionals
- Individuals interested in data analytics
- Anyone looking to build a career in business intelligence and dashboard development
Prior advanced programming knowledge is not the primary requirement for starting this beginner-focused Power BI training. The course is structured to gradually introduce learners to data importing, transformation, modeling, visualization and analysis.
Power BI Course Duration, Classes and Fee
According to the course structure, the program includes:
- Duration: 1.5 Months
- Total Classes: 12
- Class Duration: 2 Hours
- Mode: Offline Classroom Training
- Course Fee: ₹3,999/-
The course also includes instructor-led classroom training, practical learning, real-world projects, certificate of completion, doubt-clearing support and career guidance.
Why Choose Educational Excellence for Power BI Training?
Educational Excellence focuses on practical, career-oriented learning rather than only theoretical instruction. The course structure combines instructor-led sessions with hands-on dashboard development and real-world project work.
The course is conducted by Tapu Goswami, Faculty at Educational Excellence, who is a Google Certified professional with 14+ years of experience in the IT and training field. His industry and teaching experience supports a practical approach to explaining concepts and connecting technical skills with real-world applications.
For learners in Durgapur who prefer classroom-based training, offline instructor-led Power BI training can provide opportunities to ask questions directly, receive guidance during practical exercises and work through project-related challenges.
Power BI Data Analytics: Career-Relevant Skills
Learning Power BI is not simply about creating attractive charts. A strong Power BI learner should understand the complete analytics workflow:
Data → Data Cleaning → Data Transformation → Data Modeling → DAX → Visualization → Dashboard → Business Insights
This workflow helps learners understand how raw business data can be transformed into information that supports decision-making.
Power BI skills can also complement knowledge of Microsoft Excel, Power Query, DAX, business intelligence, data visualization, data modeling, KPI reporting and business analytics.
Frequently Asked Questions About Power BI Course
1. Is this Power BI course suitable for beginners?
Yes. The course is designed with a beginner-to-practical approach, covering Power BI fundamentals before moving into data transformation, modeling, DAX, visualizations and dashboard development.
2. Do I need programming knowledge to learn Power BI?
Advanced programming knowledge is not the primary requirement for starting Power BI. The course focuses on practical data analytics concepts, Power Query, data modeling, DAX and visualization.
3. How long is the Power BI course?
The course duration is 1.5 months, consisting of 12 classes, with each class lasting approximately 2 hours.
4. What practical projects are included?
The course includes practical projects such as Sales Dashboard, HR Dashboard and Marketing Dashboard, covering performance analysis, employee analytics, campaign metrics and other business insights.
5. Will I learn DAX in this course?
Yes. The curriculum includes DAX Basics & Measures, along with calculated columns and tables.
6. Will I learn Power Query?
Yes. Power Query is covered for data cleaning and transformation, along with operations such as Merge, Append, Pivot and Unpivot.
7. Is this an online or offline Power BI course?
The advertised course is offline classroom training at Educational Excellence in Durgapur.
8. What is the Power BI course fee?
The listed course fee is ₹3,999/-.
9. Is a certificate provided after completing the course?
Yes. The course highlights include a Certificate of Completion.
10. Who is the instructor?
The course is conducted by Tapu Goswami, Faculty at Educational Excellence, a Google Certified professional with 14+ years of experience in IT and training.
Conclusion
Power BI can be an effective tool for anyone who wants to develop practical data analytics, business intelligence and dashboard development skills. From importing Excel data and cleaning datasets with Power Query to creating relationships, writing DAX measures and designing interactive dashboards, learning Power BI provides a structured approach to working with business data.
For students, fresh graduates, professionals and business users in Durgapur, the Educational Excellence Power BI Data Analytics Course offers a focused 1.5-month classroom program with 12 practical sessions, real-world projects, certificate of completion, doubt-clearing support and career guidance.
If your goal is to build job-ready dashboards, gain practical data analytics skills and understand how businesses use data for decision-making, Power BI is a valuable skill to add to your professional toolkit.

